
あやめの識別を行ってみる(決定木)
機械学習としてあやめの分類を決定木を用いて行っていきます。
あやめの分類とは機械学習として有名な分類方法の試験であり、あやめを構成する4つの属性(がく片の長さ、がく片の幅、花びらの長さ、花びらの幅)をもとに、setosa(ヒオウギアヤメ)、Versicolour(ブルーフラッグ)、Virginicaの3種類のいずれの種類かを判定します。
今回は決定木を用いて3クラス問題の識別を行っていきます。
使用するデータ
使用データ:scikit-learn(datasets.load_iris)
全データ:150件 (訓練用:7割、評価用:3割に分割)
説明変数:4個(がく片の長さ、がく片の幅、花びらの長さ、花びらの幅)
目的変数::3クラス問題(setosa(ヒオウギアヤメ)、Versicolour(ブルーフラッグ)、Virginica)
回帰/識別:識別(3クラス)
識別方法:決定木
ソースコード
|
1 2 3 4 5 6 7 8 9 10 11 12 13 14 15 16 17 18 19 20 21 22 23 24 25 26 27 28 29 30 31 32 33 34 35 36 37 38 39 40 41 42 43 44 45 46 47 48 49 50 51 52 53 54 55 56 57 58 59 60 61 62 63 64 65 66 67 68 69 70 71 72 73 74 75 76 77 78 79 80 81 82 83 84 85 |
#各種ライブラリのImport import pandas as pd import numpy as np import matplotlib.pyplot as plt #%matplotlib inline #決定木のモデルを描画するためのImport from sklearn.tree import export_graphviz import pydotplus from IPython.display import Image #scikit-learnよりあやめのデータを抽出する from sklearn import datasets data = datasets.load_iris() #あやめのデータの詳細 print(data.DESCR) #あやめのデータ(説明変数)をdataXに格納する dataX = pd.DataFrame(data=data.data,columns=data.feature_names) dataX.head() #あやめのデータ(目的変数)をdataYに格納する dataY = pd.DataFrame(data=data.target) dataY = dataY.rename(columns={0: 'Species'}) dataY.head() #対応する名前に変換する def name(num): if num == 0: return 'Setosa' elif num == 1: return 'Veriscolour' else: return 'Virginica' dataY['Species'] = dataY['Species'].apply(name) dataY.head() #データの分割を行う(訓練用データ 0.7 評価用データ 0.3) from sklearn.model_selection import train_test_split X_train, X_test, Y_train, Y_test = train_test_split(dataX, dataY, test_size=0.3) #線形モデル(決定木)として測定器を作成する from sklearn.tree import DecisionTreeClassifier clf = DecisionTreeClassifier() #訓練の実施 clf.fit(X_train,Y_train) #決定木の描画を行う export_graphviz(clf, out_file="tree.dot", feature_names=X_train.columns, class_names=["0","1","2"], filled=True, rounded=True) g = pydotplus.graph_from_dot_file(path="tree.dot") g.write_png('figure-decisionTree.png') Image(g.create_png()) #評価の実行 df = pd.DataFrame(clf.predict_proba(X_test)) df = df.rename(columns={0: 'Setosa',1: 'Veriscolour',2: 'Virginica'}) df.head() #評価の実行(判定) df = pd.DataFrame(clf.predict(X_test)) df = df.rename(columns={0: '判定'}) df = df.rename(columns={0: 'Setosa',1: 'Veriscolour',2: 'Virginica'}) df.head() #混同行列 from sklearn.metrics import confusion_matrix df = pd.DataFrame(confusion_matrix(Y_test,clf.predict(X_test).reshape(-1,1), labels=['Setosa','Veriscolour','Virginica'])) df = df.rename(columns={0: '予(Setosa)',1: '予(Veriscolour)',2: '予(Virginica)'}, index={0: '実(Setosa)',1: '実(Veriscolour)',2: '実(Virginica)'}) df #評価の実行(正答率) clf.score(X_test,Y_test) #評価の実行(個々の詳細) ng=0 for i,j in zip(clf.predict(X_test),Y_test.values.reshape(-1,1)): if i == j: print(i,j,"OK") else: print(i,j,"NG") ng += 1 |
ソースコードの詳細説明
各種ライブラリのImport
|
1 2 3 4 5 |
#各種ライブラリのImport import pandas as pd import numpy as np import matplotlib.pyplot as plt #%matplotlib inline |
決定木のモデルを描画するためのImport
|
1 2 3 4 |
#決定木のモデルを描画するためのImport from sklearn.tree import export_graphviz import pydotplus from IPython.display import Image |
scikit-learnよりあやめのデータを抽出する
|
1 2 3 |
#scikit-learnよりあやめのデータを抽出する from sklearn import datasets data = datasets.load_iris() |
このデータは150個分のデータがあり、がく片の長さ、がく片の幅、花びらの長さ、花びらの幅の4つの説明変数を持っています。
それぞれに対して目的変数となるあやめの種類が3種類定義されています。
あやめの種類はsetosa(ヒオウギアヤメ)、Versicolour(ブルーフラッグ)、Virginicaとなります。
あやめのデータの詳細
|
1 2 |
#あやめのデータの詳細 print(data.DESCR) |
|
1 2 3 4 5 6 7 8 9 10 11 12 13 14 15 16 17 18 19 20 21 22 23 24 25 26 27 28 29 30 31 32 33 34 35 36 37 38 39 40 41 42 43 44 45 46 47 48 49 50 51 52 53 54 55 56 57 58 59 60 61 62 |
Iris Plants Database ==================== Notes ----- Data Set Characteristics: :Number of Instances: 150 (50 in each of three classes) :Number of Attributes: 4 numeric, predictive attributes and the class :Attribute Information: - sepal length in cm - sepal width in cm - petal length in cm - petal width in cm - class: - Iris-Setosa - Iris-Versicolour - Iris-Virginica :Summary Statistics: ============== ==== ==== ======= ===== ==================== Min Max Mean SD Class Correlation ============== ==== ==== ======= ===== ==================== sepal length: 4.3 7.9 5.84 0.83 0.7826 sepal width: 2.0 4.4 3.05 0.43 -0.4194 petal length: 1.0 6.9 3.76 1.76 0.9490 (high!) petal width: 0.1 2.5 1.20 0.76 0.9565 (high!) ============== ==== ==== ======= ===== ==================== :Missing Attribute Values: None :Class Distribution: 33.3% for each of 3 classes. :Creator: R.A. Fisher :Donor: Michael Marshall (MARSHALL%PLU@io.arc.nasa.gov) :Date: July, 1988 This is a copy of UCI ML iris datasets. http://archive.ics.uci.edu/ml/datasets/Iris The famous Iris database, first used by Sir R.A Fisher This is perhaps the best known database to be found in the pattern recognition literature. Fisher's paper is a classic in the field and is referenced frequently to this day. (See Duda & Hart, for example.) The data set contains 3 classes of 50 instances each, where each class refers to a type of iris plant. One class is linearly separable from the other 2; the latter are NOT linearly separable from each other. References ---------- - Fisher,R.A. "The use of multiple measurements in taxonomic problems" Annual Eugenics, 7, Part II, 179-188 (1936); also in "Contributions to Mathematical Statistics" (John Wiley, NY, 1950). - Duda,R.O., & Hart,P.E. (1973) Pattern Classification and Scene Analysis. (Q327.D83) John Wiley & Sons. ISBN 0-471-22361-1. See page 218. - Dasarathy, B.V. (1980) "Nosing Around the Neighborhood: A New System Structure and Classification Rule for Recognition in Partially Exposed Environments". IEEE Transactions on Pattern Analysis and Machine Intelligence, Vol. PAMI-2, No. 1, 67-71. - Gates, G.W. (1972) "The Reduced Nearest Neighbor Rule". IEEE Transactions on Information Theory, May 1972, 431-433. - See also: 1988 MLC Proceedings, 54-64. Cheeseman et al"s AUTOCLASS II conceptual clustering system finds 3 classes in the data. - Many, many more ... |
あやめのデータ(説明変数)をdataXに格納する
|
1 2 3 |
#あやめのデータ(説明変数)をdataXに格納する dataX = pd.DataFrame(data=data.data,columns=data.feature_names) dataX.head() |
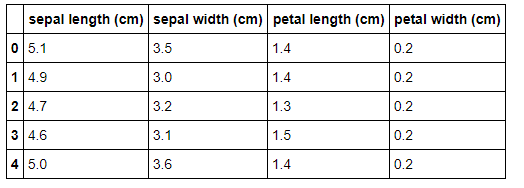
取り出したデータから説明変数となる部分のみを抽出し、dataXという名前のデータフレームに格納しています。
あやめのデータ(目的変数)をdataYに格納する
|
1 2 3 4 |
#あやめのデータ(目的変数)をdataYに格納する dataY = pd.DataFrame(data=data.target) dataY = dataY.rename(columns={0: 'Species'}) dataY.head() |
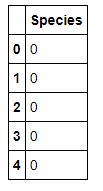
取り出したデータから目的変数となる部分のみを抽出し、dataYという名前のデータフレームに格納しています。
対応する名前に変換する
|
1 2 3 4 5 6 7 8 9 10 11 |
#対応する名前に変換する def name(num): if num == 0: return 'Setosa' elif num == 1: return 'Veriscolour' else: return 'Virginica' dataY['Species'] = dataY['Species'].apply(name) dataY.head() |

先ほど表示したdataYは0,1,2の数値で表示されており、種別が分かりにくいのでリネームしています。nameという関数を作成し、0の場合はSetosa、1の場合はVeriscolour、2の場合はVirginicaと表示するようにしています。
データの分割を行う(訓練用データ 0.7 評価用データ 0.3)
|
1 2 3 |
#データの分割を行う(訓練用データ 0.7 評価用データ 0.3) from sklearn.model_selection import train_test_split X_train, X_test, Y_train, Y_test = train_test_split(dataX, dataY, test_size=0.3) |
線形モデル(決定木)として測定器を作成する
|
1 2 3 |
#線形モデル(決定木)として測定器を作成する from sklearn.tree import DecisionTreeClassifier clf = DecisionTreeClassifier() |
訓練の実施
|
1 2 |
#訓練の実施 clf.fit(X_train,Y_train) |
|
1 2 3 4 5 6 |
DecisionTreeClassifier(class_weight=None, criterion='gini', max_depth=None, max_features=None, max_leaf_nodes=None, min_impurity_decrease=0.0, min_impurity_split=None, min_samples_leaf=1, min_samples_split=2, min_weight_fraction_leaf=0.0, presort=False, random_state=None, splitter='best') |
決定木の描画を行う
|
1 2 3 4 5 |
#決定木の描画を行う export_graphviz(clf, out_file="tree.dot", feature_names=X_train.columns, class_names=["0","1","2"], filled=True, rounded=True) g = pydotplus.graph_from_dot_file(path="tree.dot") g.write_png('figure-decisionTree.png') Image(g.create_png()) |
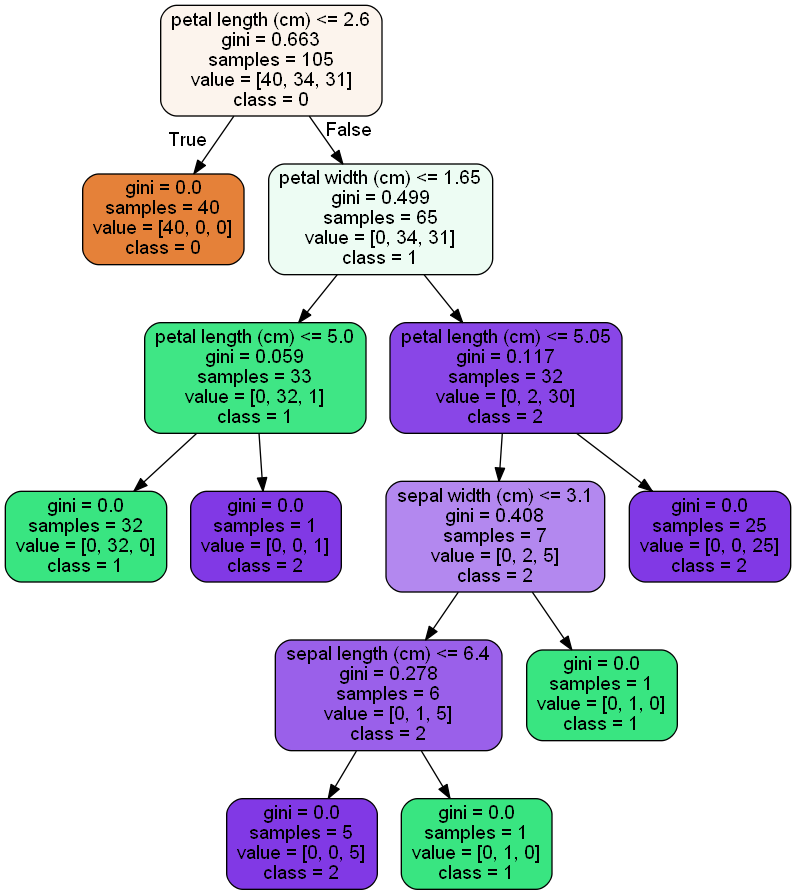
決定機の描画を行い、その結果を"figure-decisionTree.png"という名前で画像ファイルとして保存しています。図を見ると決定木の深さが5つとなっており若干過学習のようにも見えますが、今回はこのまま行っていきます。
評価の実行
|
1 2 3 4 |
#評価の実行 df = pd.DataFrame(clf.predict_proba(X_test)) df = df.rename(columns={0: 'Setosa',1: 'Veriscolour',2: 'Virginica'}) df.head() |
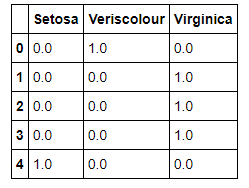
作成したモデルに対して評価を実施します。
どの種類に属するの確率を表示しています。
決定木の場合は1.0となります。決定木の場合、説明変数により分岐していって最終的な予想がどれか一つに該当するためです。
評価の実行(判定)
|
1 2 3 4 5 |
#評価の実行(判定) df = pd.DataFrame(clf.predict(X_test)) df = df.rename(columns={0: '判定'}) df = df.rename(columns={0: 'Setosa',1: 'Veriscolour',2: 'Virginica'}) df.head() |
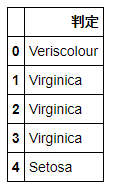
実際に判定された種別を表示しています。
混同行列の表示
|
1 2 3 4 5 |
#混同行列の表示 from sklearn.metrics import confusion_matrix df = pd.DataFrame(confusion_matrix(Y_test,clf.predict(X_test).reshape(-1,1), labels=['Setosa','Veriscolour','Virginica'])) df = df.rename(columns={0: '予(Setosa)',1: '予(Veriscolour)',2: '予(Virginica)'}, index={0: '実(Setosa)',1: '実(Veriscolour)',2: '実(Virginica)'}) df |

混同行列を行ってみます。混同行列とは縦軸に実際の正解値、横軸に予想の値のクロス表を作成することで、どの程度正解したかどうかを表します。混同行列の結果から、33個が正解し、2個が失敗したことが分かります。
評価の実行(正答率)
|
1 2 |
#評価の実行(正答率) clf.score(X_test,Y_test) |
|
1 |
0.9555555555555556 |
評価の実行(個々の詳細)
|
1 2 3 4 5 6 7 8 |
#評価の実行(個々の詳細) ng=0 for i,j in zip(clf.predict(X_test),Y_test.values.reshape(-1,1)): if i == j: print(i,j,"OK") else: print(i,j,"NG") ng += 1 |
|
1 2 3 4 5 6 7 8 9 10 11 12 13 14 15 16 17 18 19 20 21 22 23 24 25 26 27 28 29 30 31 32 33 34 35 36 37 38 39 40 41 42 43 44 45 |
Veriscolour ['Veriscolour'] OK Virginica ['Veriscolour'] NG Virginica ['Virginica'] OK Virginica ['Virginica'] OK Setosa ['Setosa'] OK Veriscolour ['Veriscolour'] OK Virginica ['Virginica'] OK Virginica ['Virginica'] OK Veriscolour ['Veriscolour'] OK Virginica ['Virginica'] OK Veriscolour ['Veriscolour'] OK Veriscolour ['Veriscolour'] OK Setosa ['Setosa'] OK Veriscolour ['Veriscolour'] OK Setosa ['Setosa'] OK Setosa ['Setosa'] OK Veriscolour ['Veriscolour'] OK Virginica ['Virginica'] OK Veriscolour ['Veriscolour'] OK Setosa ['Setosa'] OK Virginica ['Virginica'] OK Virginica ['Virginica'] OK Veriscolour ['Veriscolour'] OK Virginica ['Virginica'] OK Virginica ['Virginica'] OK Virginica ['Virginica'] OK Virginica ['Virginica'] OK Virginica ['Virginica'] OK Veriscolour ['Veriscolour'] OK Setosa ['Setosa'] OK Setosa ['Setosa'] OK Veriscolour ['Virginica'] NG Virginica ['Virginica'] OK Virginica ['Virginica'] OK Setosa ['Setosa'] OK Virginica ['Virginica'] OK Veriscolour ['Veriscolour'] OK Setosa ['Setosa'] OK Veriscolour ['Veriscolour'] OK Veriscolour ['Veriscolour'] OK Veriscolour ['Veriscolour'] OK Setosa ['Setosa'] OK Virginica ['Virginica'] OK Veriscolour ['Veriscolour'] OK Virginica ['Virginica'] OK |
今回は決定木を用いて識別問題を行っていきました。過去にはTensorflow + Kerasで違う方法も行っているので興味がある場合はそちらも参照してください。