
3種類のワインの科学的特徴を行ってみる(決定木)
機械学習として3種類のワインの科学的特徴を決定木を用いて行っていきます。
3種類のワインの科学的特徴はscikit-leanで用意されているデータセットの一つでアルコール量、色などの13個の説明変数より、3種類のワインを分類する機械学習となります。今回は決定木を用いて3クラス問題の識別を行っていきます。
使用するデータ
使用データ:scikit-learn(load_wine)
全データ:178件 (訓練用:7割、評価用:3割に分割)
説明変数:13個(アルコール量、色・・・)
目的変数::3クラス問題(class_0、class_1、class_2)
回帰/識別:識別(3クラス)
識別方法:決定木
ソースコード
|
1 2 3 4 5 6 7 8 9 10 11 12 13 14 15 16 17 18 19 20 21 22 23 24 25 26 27 28 29 30 31 32 33 34 35 36 37 38 39 40 41 42 43 44 45 46 47 48 49 50 51 52 53 54 55 56 57 58 59 60 61 62 63 64 65 66 67 68 69 70 71 72 |
#各種ライブラリのImport import pandas as pd import numpy as np import matplotlib.pyplot as plt #%matplotlib inline #決定木のモデルを描画するためのImport from sklearn.tree import export_graphviz import pydotplus from IPython.display import Image #scikit-leanよりワインのデータをインポートする from sklearn.datasets import load_wine data= load_wine() #データセットの詳細 print(data.DESCR) #説明変数の表示 dataX = pd.DataFrame(data=data.data,columns=data.feature_names) dataX.head() #目的変数の表示 dataY = pd.DataFrame(data=data.target) dataY = dataY.rename(columns={0: 'class'}) dataY.head() #データの分割を行う(訓練用データ 0.7 評価用データ 0.3) from sklearn.model_selection import train_test_split X_train, X_test, Y_train, Y_test = train_test_split(dataX, dataY, test_size=0.3) #線形モデル(決定木)として測定器を作成する from sklearn.tree import DecisionTreeClassifier clf = DecisionTreeClassifier() #訓練の実施 clf.fit(X_train,Y_train) #決定木の描画を行う export_graphviz(clf, out_file="tree.dot", feature_names=X_train.columns, class_names=["0","1","2"], filled=True, rounded=True) g = pydotplus.graph_from_dot_file(path="tree.dot") g.write_png('figure-decisionTree.png') Image(g.create_png()) #評価の実行 df = pd.DataFrame(clf.predict_proba(X_test)) df = df.rename(columns={0: 'class_0',1: 'class_1',2: 'class_2'}) df.head() #評価の実行(判定) df = pd.DataFrame(clf.predict(X_test)) df = df.rename(columns={0: '判定'}) df.head() #混同行列 from sklearn.metrics import confusion_matrix df = pd.DataFrame(confusion_matrix(Y_test,clf.predict(X_test).reshape(-1,1))) df = df.rename(columns={0: '予(class_0)',1: '予(class_1)',2: '予(class_2)'}, index={0: '実(class_0)',1: '実(class_1)',2: '実(class_2)'}) df #評価の実行(正答率) clf.score(X_test,Y_test) #評価の実行(個々の詳細) ng=0 for i,j in zip(clf.predict(X_test),Y_test.values.reshape(-1,1)): if i == j: print(i,j,"OK") else: print(i,j,"NG") ng += 1 |
ソースコードの詳細
各種ライブラリのImport
|
1 2 3 4 5 |
#各種ライブラリのImport import pandas as pd import numpy as np import matplotlib.pyplot as plt #%matplotlib inline |
決定木のモデルを描画するためのImport
|
1 2 3 4 |
#決定木のモデルを描画するためのImport from sklearn.tree import export_graphviz import pydotplus from IPython.display import Image |
scikit-leanよりワインのデータをインポートする
|
1 2 3 |
#scikit-leanよりワインのデータをインポートする from sklearn.datasets import load_wine data= load_wine() |
このデータは178個分のデータがあり、アルコール、色などの13個の説明変数を持っています・
それぞれに対して目的変数となるワインの種類が3種類定義されています。
3種類の具体的な名称は不明ですが、class_0、class_1、class_2と定義されています。
データセットの詳細
|
1 2 |
#データセットの詳細 print(data.DESCR) |
|
1 2 3 4 5 6 7 8 9 10 11 12 13 14 15 16 17 18 19 20 21 22 23 24 25 26 27 28 29 30 31 32 33 34 35 36 37 38 39 40 41 42 43 44 45 46 47 48 49 50 51 52 53 54 55 56 57 58 59 60 61 62 63 64 65 66 67 68 69 70 71 72 73 74 75 76 77 78 79 80 81 82 83 84 85 86 87 88 89 90 91 92 93 94 95 |
Wine Data Database ==================== Notes ----- Data Set Characteristics: :Number of Instances: 178 (50 in each of three classes) :Number of Attributes: 13 numeric, predictive attributes and the class :Attribute Information: - 1) Alcohol - 2) Malic acid - 3) Ash - 4) Alcalinity of ash - 5) Magnesium - 6) Total phenols - 7) Flavanoids - 8) Nonflavanoid phenols - 9) Proanthocyanins - 10)Color intensity - 11)Hue - 12)OD280/OD315 of diluted wines - 13)Proline - class: - class_0 - class_1 - class_2 :Summary Statistics: ============================= ==== ===== ======= ===== Min Max Mean SD ============================= ==== ===== ======= ===== Alcohol: 11.0 14.8 13.0 0.8 Malic Acid: 0.74 5.80 2.34 1.12 Ash: 1.36 3.23 2.36 0.27 Alcalinity of Ash: 10.6 30.0 19.5 3.3 Magnesium: 70.0 162.0 99.7 14.3 Total Phenols: 0.98 3.88 2.29 0.63 Flavanoids: 0.34 5.08 2.03 1.00 Nonflavanoid Phenols: 0.13 0.66 0.36 0.12 Proanthocyanins: 0.41 3.58 1.59 0.57 Colour Intensity: 1.3 13.0 5.1 2.3 Hue: 0.48 1.71 0.96 0.23 OD280/OD315 of diluted wines: 1.27 4.00 2.61 0.71 Proline: 278 1680 746 315 ============================= ==== ===== ======= ===== :Missing Attribute Values: None :Class Distribution: class_0 (59), class_1 (71), class_2 (48) :Creator: R.A. Fisher :Donor: Michael Marshall (MARSHALL%PLU@io.arc.nasa.gov) :Date: July, 1988 This is a copy of UCI ML Wine recognition datasets. <a target="_blank" href="https://archive.ics.uci.edu/ml/machine-learning-databases/wine/wine.data" rel="noopener" data-mce-href="https://archive.ics.uci.edu/ml/machine-learning-databases/wine/wine.data">https://archive.ics.uci.edu/ml/machine-learning-databases/wine/wine.data</a> The data is the results of a chemical analysis of wines grown in the same region in Italy by three different cultivators. There are thirteen different measurements taken for different constituents found in the three types of wine. Original Owners: Forina, M. et al, PARVUS - An Extendible Package for Data Exploration, Classification and Correlation. Institute of Pharmaceutical and Food Analysis and Technologies, Via Brigata Salerno, 16147 Genoa, Italy. Citation: Lichman, M. (2013). UCI Machine Learning Repository [http://archive.ics.uci.edu/ml]. Irvine, CA: University of California, School of Information and Computer Science. References ---------- (1) S. Aeberhard, D. Coomans and O. de Vel, Comparison of Classifiers in High Dimensional Settings, Tech. Rep. no. 92-02, (1992), Dept. of Computer Science and Dept. of Mathematics and Statistics, James Cook University of North Queensland. (Also submitted to Technometrics). The data was used with many others for comparing various classifiers. The classes are separable, though only RDA has achieved 100% correct classification. (RDA : 100%, QDA 99.4%, LDA 98.9%, 1NN 96.1% (z-transformed data)) (All results using the leave-one-out technique) (2) S. Aeberhard, D. Coomans and O. de Vel, "THE CLASSIFICATION PERFORMANCE OF RDA" Tech. Rep. no. 92-01, (1992), Dept. of Computer Science and Dept. of Mathematics and Statistics, James Cook University of North Queensland. (Also submitted to Journal of Chemometrics). |
説明変数の表示
|
1 2 3 |
#説明変数の表示 dataX = pd.DataFrame(data=data.data,columns=data.feature_names) dataX.head() |

取り出したデータから説明変数となる部分のみを抽出し、dataXという名前のデータフレームに格納しています。
目的変数の表示
|
1 2 3 4 |
#目的変数の表示 dataY = pd.DataFrame(data=data.target) dataY = dataY.rename(columns={0: 'class'}) dataY.head() |
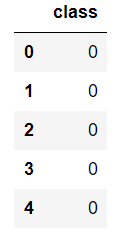
取り出したデータから目的変数となる部分のみを抽出し、dataYという名前のデータフレームに格納しています。
データの分割を行う(訓練用データ 0.7 評価用データ 0.3)
|
1 2 3 |
#データの分割を行う(訓練用データ 0.7 評価用データ 0.3) from sklearn.model_selection import train_test_split X_train, X_test, Y_train, Y_test = train_test_split(dataX, dataY, test_size=0.3) |
線形モデル(決定木)として測定器を作成する
|
1 2 3 |
#線形モデル(決定木)として測定器を作成する from sklearn.tree import DecisionTreeClassifier clf = DecisionTreeClassifier() |
訓練の実施
|
1 2 |
#訓練の実施 clf.fit(X_train,Y_train) |
|
1 2 3 4 5 6 |
DecisionTreeClassifier(class_weight=None, criterion='gini', max_depth=None, max_features=None, max_leaf_nodes=None, min_impurity_decrease=0.0, min_impurity_split=None, min_samples_leaf=1, min_samples_split=2, min_weight_fraction_leaf=0.0, presort=False, random_state=None, splitter='best') |
決定木の描画を行う
|
1 2 3 4 5 |
#決定木の描画を行う export_graphviz(clf, out_file="tree.dot", feature_names=X_train.columns, class_names=["0","1","2"], filled=True, rounded=True) g = pydotplus.graph_from_dot_file(path="tree.dot") g.write_png('figure-decisionTree.png') Image(g.create_png()) |
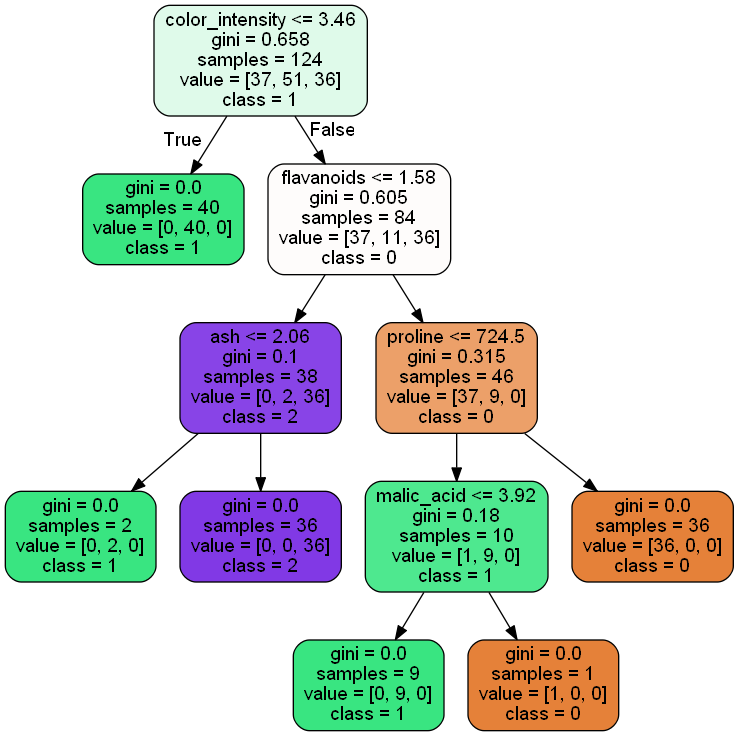
決定木の描画を行い、その結果を"figure-decisionTree.png"という名前で画像ファイルとして保存しています。図を見ると決定木の深さが5つとなっています。
評価の実行
|
1 2 3 4 |
#評価の実行 df = pd.DataFrame(clf.predict_proba(X_test)) df = df.rename(columns={0: 'class_0',1: 'class_1',2: 'class_2'}) df.head() |
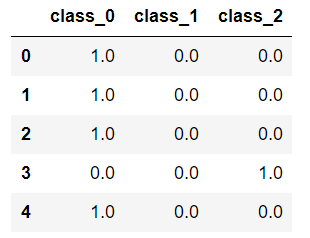
作成したモデルに対して評価を実施します。
どの種類に属するの確率を表示しています。
決定木の場合は1.0となります。決定木の場合、説明変数により分岐していって最終的な予想がどれか一つに該当するためです。
評価の実行(判定)
|
1 2 3 4 |
#評価の実行(判定) df = pd.DataFrame(clf.predict(X_test)) df = df.rename(columns={0: '判定'}) df.head() |
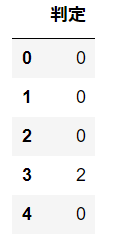
判定結果を表示しています。
混同行列
|
1 2 3 4 5 |
#混同行列 from sklearn.metrics import confusion_matrix df = pd.DataFrame(confusion_matrix(Y_test,clf.predict(X_test).reshape(-1,1))) df = df.rename(columns={0: '予(class_0)',1: '予(class_1)',2: '予(class_2)'}, index={0: '実(class_0)',1: '実(class_1)',2: '実(class_2)'}) df |
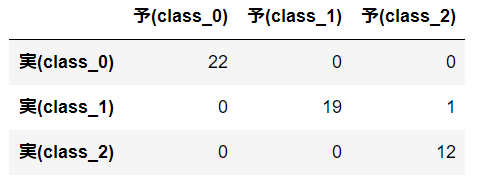
混同行列を行ってみます。混同行列とは縦軸に実際の正解値、横軸に予想の値のクロス表を作成することで、どの程度正解したかどうかを表します。混同行列の結果から、53個が正解し、1個が失敗したことが分かります。この結果から正答率は高そうです。
評価の実行(正答率)
|
1 2 |
#評価の実行(正答率) clf.score(X_test,Y_test) |
|
1 |
0.98148148148148151 |
評価の実行(個々の詳細)
|
1 2 3 4 5 6 7 8 |
#評価の実行(個々の詳細) ng=0 for i,j in zip(clf.predict(X_test),Y_test.values.reshape(-1,1)): if i == j: print(i,j,"OK") else: print(i,j,"NG") ng += 1 |
|
1 2 3 4 5 6 7 8 9 10 11 12 13 14 15 16 17 18 19 20 21 22 23 24 25 26 27 28 29 30 31 32 33 34 35 36 37 38 39 40 41 42 43 44 45 46 47 48 49 50 51 52 53 54 |
0 [0] OK 0 [0] OK 0 [0] OK 2 [1] NG 0 [0] OK 2 [2] OK 0 [0] OK 2 [2] OK 0 [0] OK 0 [0] OK 1 [1] OK 2 [2] OK 0 [0] OK 2 [2] OK 2 [2] OK 1 [1] OK 2 [2] OK 1 [1] OK 2 [2] OK 1 [1] OK 0 [0] OK 1 [1] OK 1 [1] OK 2 [2] OK 0 [0] OK 1 [1] OK 2 [2] OK 1 [1] OK 1 [1] OK 1 [1] OK 0 [0] OK 0 [0] OK 1 [1] OK 0 [0] OK 0 [0] OK 2 [2] OK 0 [0] OK 0 [0] OK 2 [2] OK 1 [1] OK 0 [0] OK 1 [1] OK 1 [1] OK 1 [1] OK 1 [1] OK 0 [0] OK 1 [1] OK 1 [1] OK 1 [1] OK 0 [0] OK 0 [0] OK 0 [0] OK 2 [2] OK 0 [0] OK |
今回は決定木で試してみましたが、測定器をいろいろ変えて試してみようと思います。